A meta-analysis is a statistical method for combining the results of multiple independent studies that address the same research question. Instead of relying on any single trial, a meta-analysis pools effect estimates to produce a weighted summary that is typically more precise, has narrower confidence intervals, and greater statistical power than any of its component studies alone.
In evidence-based medicine and health-technology assessment, meta-analysis sits at the top of the evidence hierarchy, but only when the included studies are clinically and methodologically comparable. A meta-analysis of poor-quality or heterogeneous trials inherits those problems; the statistical machinery does not repair them. The skill lies in knowing when to pool, which model to use, how to handle heterogeneity, and how to communicate uncertainty honestly.
Key takeaways
- Meta-analysis pools effect estimates across studies, not raw participant data, and gains precision only when the studies are comparable.
- Choose your effect-size measure based on outcome type (RR, OR, HR for dichotomous; MD or SMD for continuous).
- Default to a random-effects model with REML estimation and Hartung-Knapp-Sidik-Jonkman confidence intervals.
- Interpret I2, τ2, and the prediction interval together. The prediction interval is often more useful than the pooled CI.
- If substantial heterogeneity is present, investigate with subgroup analysis and meta-regression rather than hiding it behind the diamond.
- Test for publication bias with funnel plots, Egger's regression, and trim-and-fill or PEESE when you have enough studies.
What is a meta-analysis?
A meta-analysis is the statistical synthesis of quantitative findings from two or more studies that address the same research question. By pooling effect estimates, a meta-analysis produces a weighted summary that increases statistical power, narrows confidence intervals, and can resolve conflicting findings across individual trials.
Meta-analyses are a core component of evidence-based medicine, health technology assessment, and clinical guideline development. They are also a component of many systematic reviews, though not every systematic review contains one. See the related article on systematic review vs meta-analysis for when each method is appropriate.
When not to meta-analyse
Not every systematic review should contain a meta-analysis. Pooling is inappropriate when the included studies differ substantially in:
- Population. Adults with mild versus severe disease, or different age strata where the condition behaves differently.
- Intervention. Pooling exercise trials that span yoga, HIIT, and resistance training as if they were one thing.
- Comparator. Active control, placebo, and usual care can produce very different effect sizes.
- Outcome definition or measurement. The same construct (depression, say) measured with PHQ-9 in one trial and HAM-D in another is not interchangeable without standardisation.
- Study design. Mixing randomised and non-randomised evidence without adjustment.
When these differences are too large, a narrative synthesis, structured summary, or the SWiM (Synthesis Without Meta-analysis) framework is the honest answer, not a forced pooled estimate with I2 above 90%.
Effect-size measures
The first technical decision is the choice of effect size, the metric you extract from each study and pool. The choice is driven by outcome type.
Dichotomous outcomes
- Risk ratio (RR). Probability of event in treatment versus control. Intuitive for clinicians; bounded below at zero.
- Odds ratio (OR). Ratio of odds, symmetric around one. Required in logistic-regression contexts and case-control designs; overstates effect when outcomes are common.
- Risk difference (RD). Absolute arithmetic difference. Directly interpretable as number needed to treat (NNT = 1 / RD).
- Hazard ratio (HR). The default for time-to-event data from survival models (Cox regression).
Continuous outcomes
- Mean difference (MD). Appropriate when every study used the same measurement scale and units.
- Standardised mean difference (SMD, also Cohen's d or Hedges' g). Required when studies measured the same construct with different instruments (for example anxiety via GAD-7 versus BAI). Hedges' g applies a small-sample correction to Cohen's d [1].
- Ratio of means (RoM). Useful when the geometric average is more meaningful (biomarker concentrations, for example).
Ratio measures (RR, OR, HR) are log-transformed before pooling and back-transformed for presentation. This is why forest-plot x-axes are almost always drawn on a log scale.
Fixed-effect vs random-effects models
The two standard pooling approaches answer subtly different questions.
Fixed-effect (common-effect)
Assumes every study is estimating the same true effect; all between-study variation is sampling error. Weights studies by inverse variance. Narrow CIs. Rarely defensible unless studies are near-identical (replications of the same trial). Typical estimators are Mantel-Haenszel or inverse-variance.
Random-effects (default)
Assumes each study estimates its own true effect, drawn from a distribution with mean μ and variance τ2. The pooled estimate is the mean of that distribution. Random-effects models give small studies more relative weight and produce wider CIs that reflect between-study heterogeneity as well as within-study error. Estimators include DerSimonian-Laird [2](classic, but biased with few studies), REML, and Paule-Mandel. The Hartung-Knapp-Sidik-Jonkman (HKSJ) adjustment is recommended for confidence intervals[3].
When in doubt, use a random-effects model with REML estimation and HKSJ confidence intervals. Report the fixed-effect result only as a sensitivity analysis.
How to read a forest plot
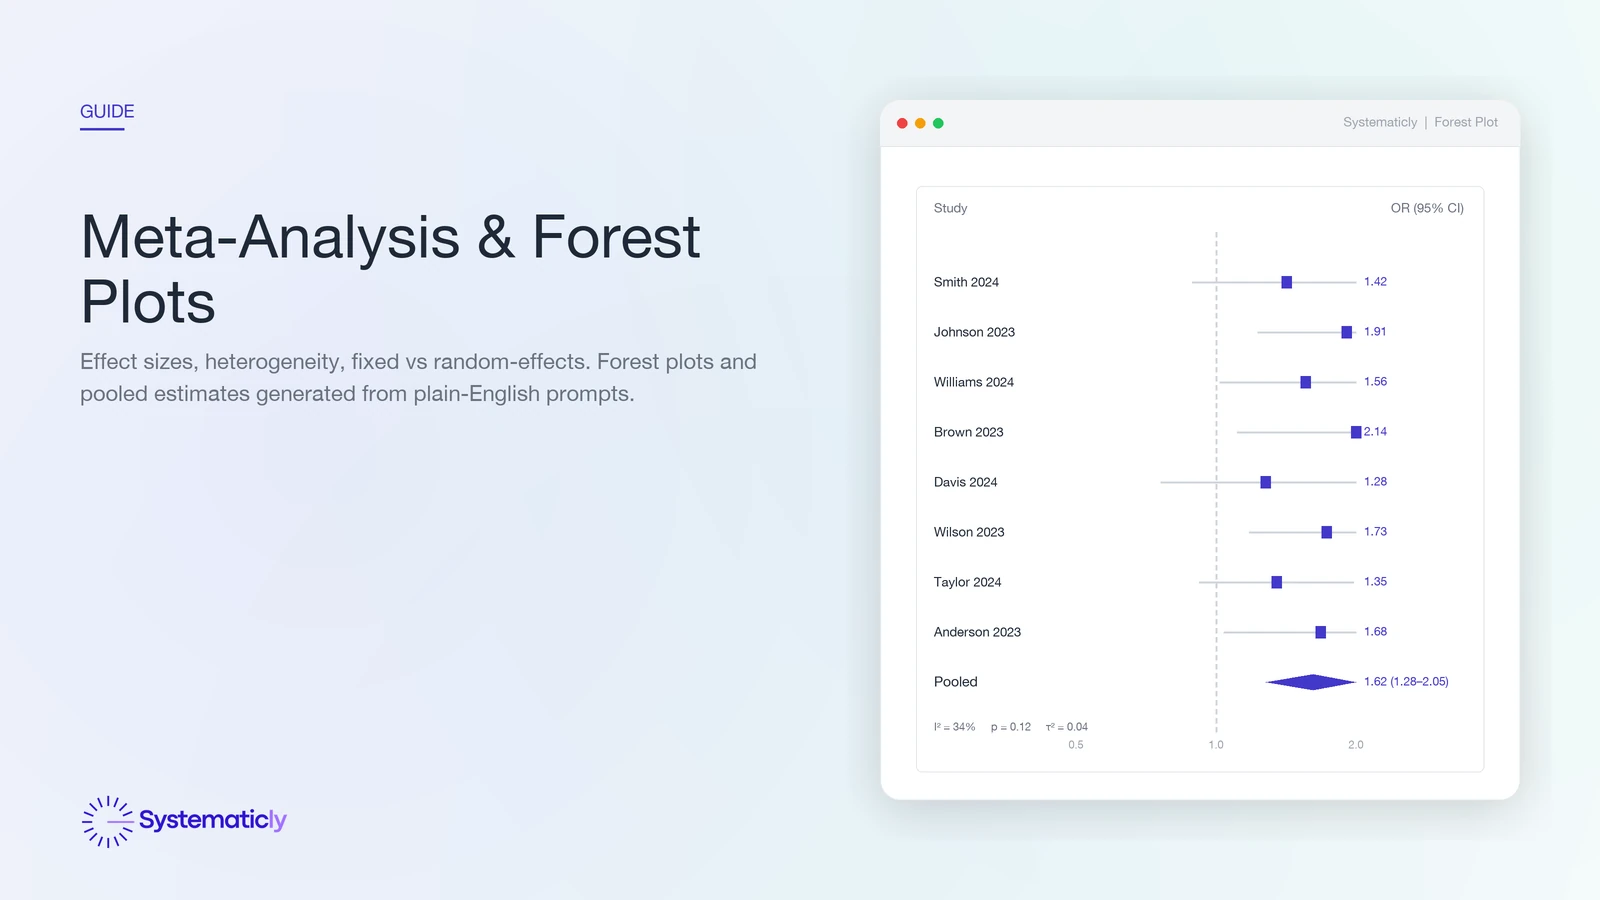
A forest plot is the standard visual summary of a meta-analysis. Each row is a study. The square is the point estimate; its area is proportional to the study's weight in the pool (larger means more informative). The horizontal line is the study's 95% confidence interval. A vertical dashed line marks the null effect (RR, OR, or HR equal to 1.0, or SMD equal to 0). The diamond at the bottom is the pooled estimate; its width is the pooled CI.
Three at-a-glance checks. First, do most studies sit on one side of the null line? Second, does the diamond cross the null? Third, how wide is the diamond relative to the null, large effect, small effect, or inconclusive? The I2, τ2, and Q row under the plot tells you how confidently you can read the diamond as a single answer.
Heterogeneity: I2, τ2, and Cochran's Q
Studies never produce identical results. Heterogeneity statistics tell you how much of that variation is real (between-study) versus chance (sampling error).
- Cochran's Q. A χ2 test of the null hypothesis that all studies share a single true effect. Under-powered when there are few studies, over-powered when there are many; p-values should not be used as a binary flag.
- I2 statistic. The percentage of total variation that is between-study rather than sampling error [4]. Cochrane rough guide:
0 to 40%may be unimportant,30 to 60%moderate,50 to 90%substantial,75 to 100%considerable. - τ2 (tau-squared). The estimated between-study variance on the effect scale. Unlike I2, τ2 does not depend on the number or size of included studies, so it is the more stable long-term descriptor of heterogeneity.
- Prediction interval. Often more useful than the CI of the mean. Tells you the range in which 95% of future studies' true effects would fall [5]. A meta-analysis with a tight CI but a wide prediction interval has a well-estimated mean but says little about any specific patient or setting.
When I2 or τ2 is high, do not hide it behind the diamond. Investigate it via subgroup analysis, meta-regression, or sensitivity analysis.
Subgroup analysis and meta-regression
When between-study heterogeneity is meaningful, the next question is why. Subgroup analysis and meta-regression explore study-level moderators that might explain variation in effect sizes.
- Subgroup analysis splits studies by a categorical moderator (intervention format, risk of bias, age group) and pools each subgroup separately. A test for subgroup differences (p for interaction) tells you whether subgroup means are statistically distinguishable.
- Meta-regression regresses the effect size on one or more study-level covariates (dose, follow-up duration, baseline severity). Requires at least around ten studies per covariate; severely under-powered in small meta-analyses.
Both are observational at the study level, so they are hypothesis-generating, not causal. Always pre-specify subgroup analyses in the protocol to avoid fishing.
Publication bias and small-study effects
Studies that find large or statistically significant effects are more likely to be published, more likely to be published quickly, and more likely to be cited, so any meta-analysis of the published record risks an upward bias in effect size. The standard diagnostic is the funnel plot.
- Funnel plot. A scatter of effect size (x) against study precision or standard error (y). A symmetric inverted funnel indicates no bias; asymmetry suggests that small null-result studies are missing.
- Egger's regression test. A formal test for funnel-plot asymmetry[6]. Low power with fewer than around ten studies.
- Trim-and-fill. Imputes hypothetical missing studies to restore symmetry and re-estimates the pooled effect. A rough sensitivity check, not a correction.
- PEESE and PET-PEESE. Regression-based adjustments that account for the size of the precision-effect relationship. More robust than trim-and-fill when bias is severe.
Funnel-plot asymmetry is not always publication bias. It can also signal genuine small-study heterogeneity, poor methodology in smaller trials, or reporting differences. Interpret alongside a quality appraisal.
Network meta-analysis
When multiple competing interventions are compared across a body of trials, pairwise meta-analysis can only speak to head-to-head comparisons that actually exist in the literature. Network meta-analysis (NMA) combines direct and indirect evidence across a network of treatments, so A can be compared to C even if no trial directly randomised A versus C, as long as both A and C have been compared to a common comparator B.
NMA produces three key outputs:
- League table. A matrix of pairwise effect estimates between every pair of treatments in the network, including indirect comparisons.
- SUCRA (Surface Under the Cumulative Ranking curve). A probability that each treatment is among the best. Useful for summarising rankings, but sensitive to the set of treatments and outcomes included.
- Network diagram. Nodes are treatments, edges are direct comparisons (thicker edges means more studies). Sparse networks should prompt caution.
NMA's validity rests on transitivity (patient and trial characteristics are exchangeable across comparisons) and consistency (direct and indirect evidence for the same comparison agree). Both should be assessed and reported per the PRISMA-NMA extension.
Sensitivity analyses
The headline result should never stand alone. Sensitivity analyses test whether the conclusion survives plausible alternative choices.
- Leave-one-out. Re-pool omitting each study in turn. If removing one study flips the direction or significance of the effect, the meta-analysis is fragile and the dominant study should be discussed.
- Restriction by risk of bias. Re-pool using only low-risk-of-bias studies. Large differences suggest the headline result is being propped up by weaker evidence.
- Model choice. Present both fixed-effect and random-effects results to show the pooling assumption's influence.
- Alternative effect metrics. For example RR versus OR, or MD versus SMD, where applicable.
- Alternative priors. In Bayesian meta-analyses, test sensitivity to the prior on τ.
Software and tools
Common meta-analysis environments include meta and metafor in R, metan in Stata, Cochrane RevMan, Comprehensive Meta-Analysis (CMA), and JASP or jamovi for point-and-click workflows. Each handles a different subset of the methods above; most require separate tooling for network meta-analysis (for example netmeta, gemtc).
Systematicly runs the full meta-analytic pipeline (effect-size extraction, model selection, forest and funnel plots, heterogeneity statistics, subgroup analyses, publication-bias checks, and network meta-analysis) inside the review workflow, and lets you describe the analysis in plain English rather than hand-writing R code.
Frequently asked questions
Do I need to meta-analyse every systematic review?
No. A meta-analysis is appropriate only when the included studies are clinically and methodologically similar enough to pool. Where populations, interventions, comparators, or outcomes differ substantially, a structured narrative synthesis or SWiM framework is the honest answer, not a pooled estimate with very high heterogeneity.
How many studies do I need before I can meta-analyse?
There is no hard minimum, but pooling two studies offers limited insight and estimating between-study variance with fewer than five studies is unreliable. Five is a practical floor for random-effects models; meta-regression generally needs at least ten studies per covariate.
Should I use a fixed-effect or a random-effects model?
Use random effects by default. Real-world clinical trials almost always differ in patient population, dose, and follow-up, so a fixed-effect model's assumption that all studies estimate the same underlying effect is rarely defensible. Report fixed-effect results only as a sensitivity analysis.
What does an I² of 75% mean for my meta-analysis?
I² of 75% indicates that 75% of the total variation between studies is due to real heterogeneity rather than sampling error. The Cochrane Handbook describes this as considerable heterogeneity. Investigate the source with subgroup analysis or meta-regression before interpreting the pooled estimate as a single answer.
How is network meta-analysis different from pairwise meta-analysis?
Pairwise meta-analysis pools trials that directly compare two treatments. Network meta-analysis combines direct and indirect evidence across a network of treatments so that A can be compared to C even without head-to-head trials, provided both A and C share a common comparator B. It relies on the transitivity and consistency assumptions.
How do I report publication bias when I only have eight studies?
With fewer than ten studies, Egger's test and trim-and-fill are underpowered and should be interpreted cautiously. Present the funnel plot visually, note the small-study limitation explicitly, and treat the pooled estimate as directional evidence rather than a precise summary.
If you are planning a meta-analysis, Systematicly can shorten the path from extracted effect sizes to a publication-ready forest plot without requiring you to hand-code in R or Stata. Start a free project at research.systematicly.com to try it with your own data.
Summary
A meta-analysis pools quantitative effect estimates from comparable studies to produce a weighted summary with greater precision than any single trial. The quality of the answer depends on the comparability of the inputs, the choice of effect-size measure and model, and honest reporting of heterogeneity and publication-bias diagnostics. Systematicly handles the statistical machinery so you can focus on the questions the machinery cannot answer.
Ready to run your meta-analysis in one place?
Systematicly handles the full analytic pipeline, from effect-size extraction to forest plots, heterogeneity statistics, and publication-bias checks. See your first pooled estimate in minutes.
References
- Hedges LV, Olkin I. Statistical Methods for Meta-Analysis. Orlando: Academic Press. 1985. ↑
- DerSimonian R, Laird N. Meta-analysis in clinical trials. Controlled Clinical Trials. 1986;7(3):177-188. ↑
- IntHout J, Ioannidis JPA, Borm GF. The Hartung-Knapp-Sidik-Jonkman method for random effects meta-analysis is straightforward and considerably outperforms the standard DerSimonian-Laird method. BMC Medical Research Methodology. 2014;14:25. ↑
- Higgins JPT, Thompson SG, Deeks JJ, Altman DG. Measuring inconsistency in meta-analyses. BMJ. 2003;327(7414):557-560. ↑
- IntHout J, Ioannidis JPA, Rovers MM, Goeman JJ. Plea for routinely presenting prediction intervals in meta-analysis. BMJ Open. 2016;6(7):e010247. ↑
- Egger M, Davey Smith G, Schneider M, Minder C. Bias in meta-analysis detected by a simple, graphical test. BMJ. 1997;315(7109):629-634. ↑
- Higgins JPT, Thomas J, Chandler J, Cumpston M, Li T, Page MJ, Welch VA (editors). Cochrane Handbook for Systematic Reviews of Interventions. Version 6.4. Cochrane. 2023.