When people compare a longitudinal study vs cross-sectional study, the core difference is time. A cross-sectional study measures exposures and outcomes in a population once, giving a snapshot of how common a condition, attitude or habit is right now. A longitudinal study goes back to the same individuals over months or years, so it can show how things change within each person and which event came first.
Almost everything else follows from that one difference. Cross-sectional research is faster and cheaper, and it is the standard way to estimate prevalence. Longitudinal research costs more, takes longer, loses people along the way and needs more careful statistics. In return, it is the only one of the two that can follow change over time in the same people.
This guide is for students planning a thesis, clinicians designing an observational project, and reviewers who classify study designs while screening evidence for a systematic review. It takes the longitudinal study vs cross-sectional decision in order: what to settle before you start, where each design sits among other study types, what each one does well, where one-time data falls short, and how to weigh the trade-offs. It also covers points many overviews skip. Repeated surveys are not the same as following a cohort. Analyzing repeated measurements as if they were separate surveys can hide real effects. And your choice of association measure can depend on how long a condition takes to develop.
Key takeaways
- A cross-sectional study measures exposure and health status once, so it estimates prevalence at a single point in time.
- A longitudinal study measures the same people more than once, so it can track change within individuals and show which event came first.
- Repeated cross-sectional surveys draw a new sample at each wave. They show change across a population, not change within any one person.
- Both designs are usually observational: the investigator records what happens and does not assign an intervention.
- Let your research question pick the design, then check your budget, timeline and how much dropout you can tolerate.
Longitudinal Study vs Cross Sectional: The Key Differences
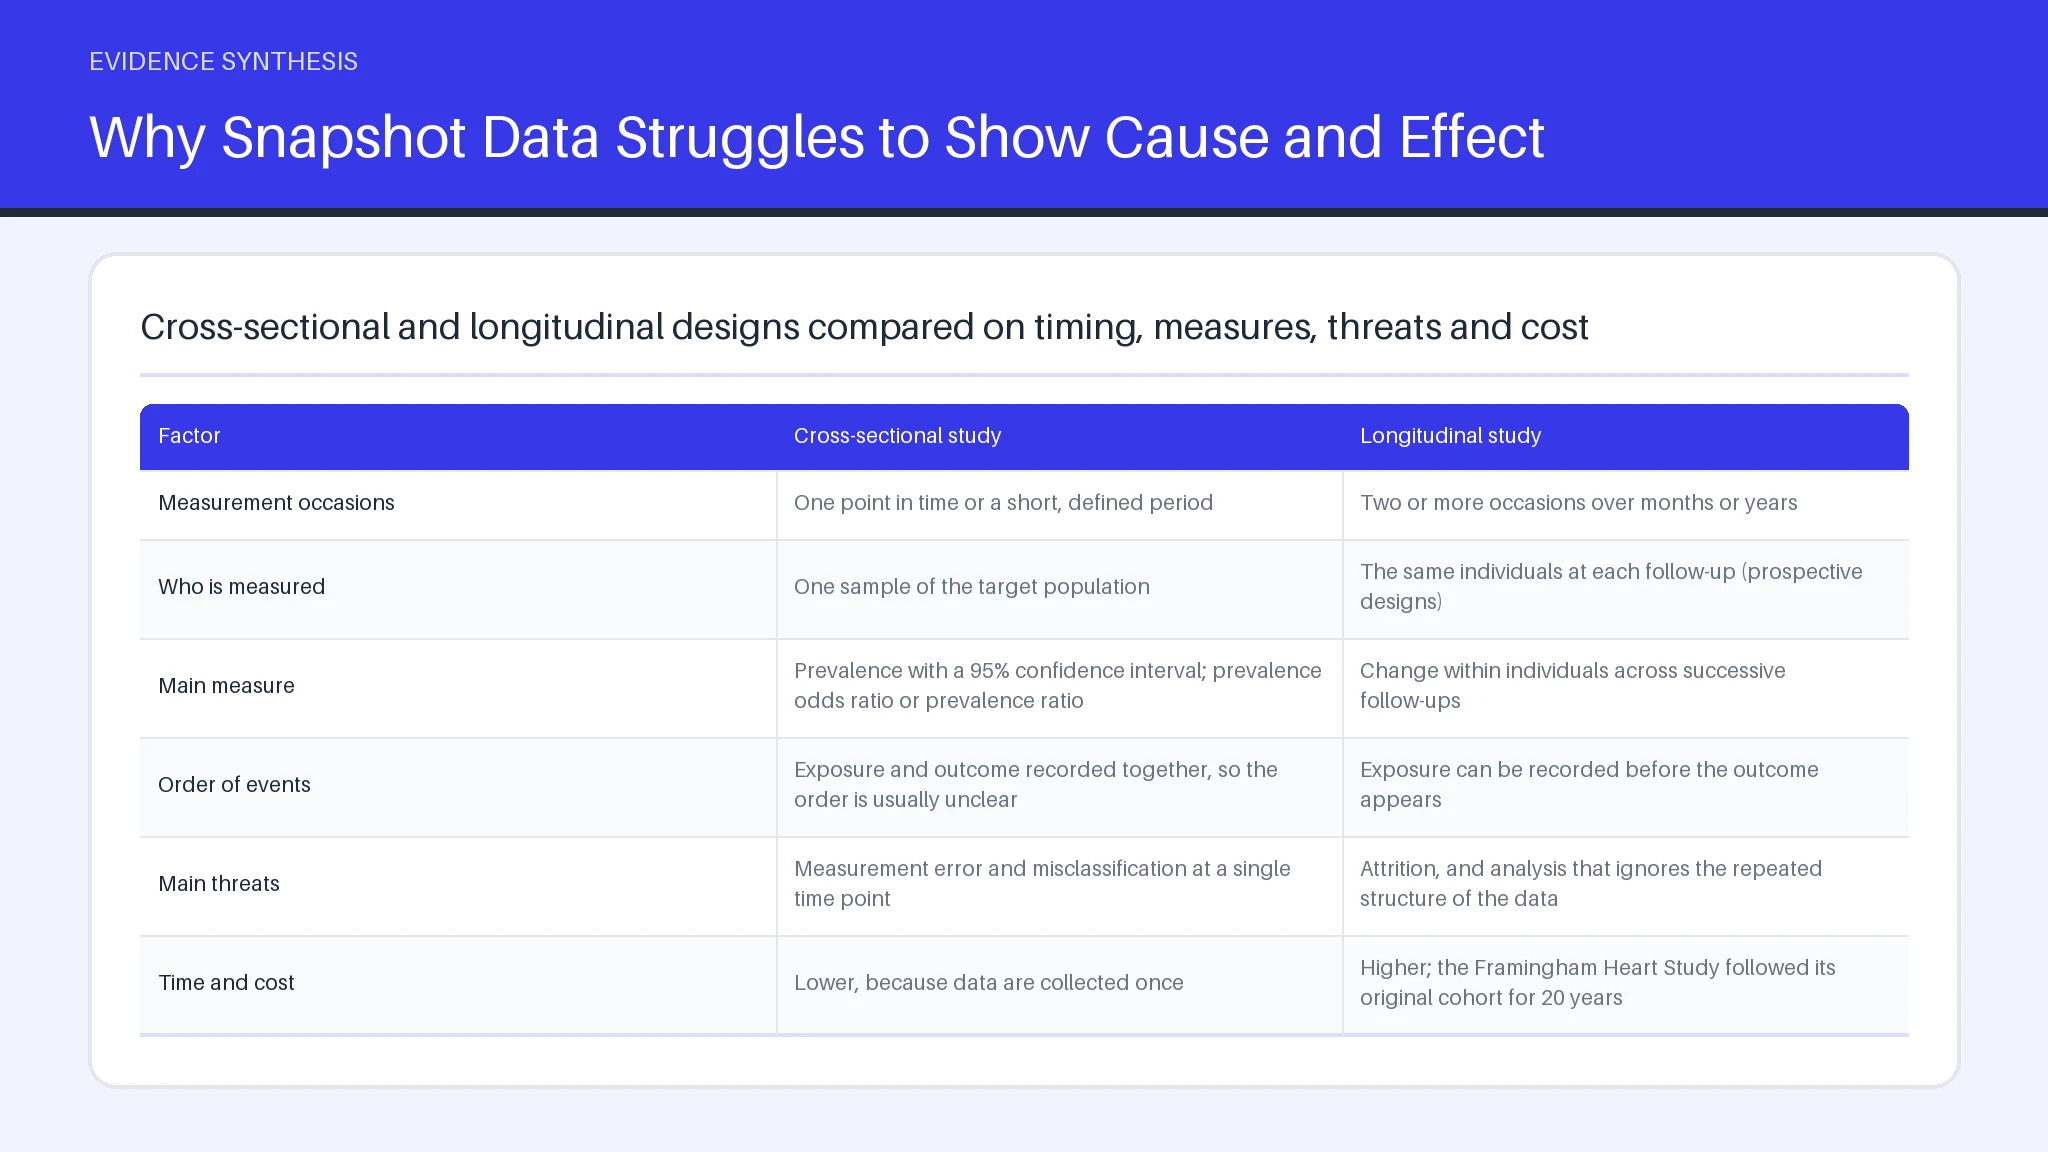
The table below lists the longitudinal study vs cross-sectional differences that matter most when you plan a project or appraise a published one.
| Factor | Cross-sectional study | Longitudinal study |
|---|---|---|
| Measurement occasions | One point in time or a short, defined period | Two or more occasions over months or years |
| Who is measured | One sample of the target population | The same individuals at each follow-up (prospective designs) |
| Main measure | Prevalence with a 95% confidence interval; prevalence odds ratio or prevalence ratio | Change within individuals across successive follow-ups |
| Order of events | Exposure and outcome recorded together, so the order is usually unclear | Exposure can be recorded before the outcome appears |
| Main threats | Measurement error and misclassification at a single time point | Attrition, and analysis that ignores the repeated structure of the data |
| Time and cost | Lower, because data are collected once | Higher; the Framingham Heart Study followed its original cohort for 20 years |
| Well-known example | PLATINO study of COPD prevalence in five Latin American cities | Framingham Heart Study, begun in 1948 |
Read down the columns and a pattern appears. Every strength of the cross-sectional design comes from measuring variables once, and every strength of the longitudinal design comes from measuring them again. That choice shapes the insights you can draw more than sample size does. A large one-time survey still cannot show what changed for any individual. A small cohort can.
Types of Research Design: Where These Two Approaches Fit
Cross-sectional and longitudinal studies both belong to the observational branch of research design, alongside case-control studies. Randomized trials belong to the interventional branch. A methods overview in the PMC archive names three elements these designs share: defining and measuring exposure in two or more groups, measuring health outcomes in those same groups, and comparing the groups statistically. What separates them is when the measurements happen and how often. For a wider map of designs, see our study design guide.
"Longitudinal" is an umbrella term, not a single design. It covers prospective cohort studies, which follow the same participants over time, and panel studies, which interview a fixed group again and again. It also covers repeated cross-sectional studies, where each wave samples mostly different people. That last group is where cross-sectional vs longitudinal classification often goes wrong. A survey run every year is longitudinal at the population level, but it tracks no individual, so it cannot show within-person change in any of the variables it measures. If a paper leaves the longitudinal study vs cross-sectional question unclear, check whether the same people appear at each measurement point.
Advantages of Cross-Sectional Studies: Speed, Cost and Prevalence
Longitudinal and cross-sectional studies are observational designs that differ in timing: the first measures the same people repeatedly, and the second measures a population once. The cross-sectional design has three clear advantages.
- Speed. Data are collected once, so results can arrive after a single survey or clinic cycle instead of years of follow-up.
- Cost. You don't track individuals between waves, recontact anyone or pay to keep people enrolled.
- Prevalence. This design is built to estimate the proportion of a population with a condition, exposure or set of behaviors at a specific time. In the PLATINO study, investigators measured smoking history and spirometry once in adults aged 40 and over in five Latin American cities. Reported COPD prevalence ranged from 8% to 20%.
A well-built descriptive cross-sectional question names three things. The first is the target population, defined by person and place and anchored in time. The second is the outcome or health state. The third is the occurrence measure, usually prevalence. A typical example is estimating periodontitis prevalence among US adults on a fixed date or across one calendar year. Good reporting gives the number of events in exposed and unexposed groups and a 95% confidence interval around the prevalence estimate.
The limitations matter in any cross-sectional vs longitudinal decision too. Repeating the survey with fresh samples shows population trends, but a single wave cannot show how any one person changed.
Should Your Project Use a Cross-Sectional or Longitudinal Design?
Let your research question settle the longitudinal study vs cross-sectional choice. A cross-sectional study captures prevalence, the proportion of people with a condition at a specific point in time (PMC). A longitudinal or cohort study follows the same people through successive follow-ups to analyze individual-level change (PMC). Before you commit, have these in hand:
- A one-sentence question that says whether you want prevalence (how many) or change (how much, in whom, after what). Our guide to writing a research question covers how to frame it.
- A defined population and time anchor. A descriptive question names the target population by person and place, anchored in time, plus the outcome and the occurrence measure, such as prevalence (PMC).
- A follow-up plan for staying in touch with participants across waves, including how you will trace people who move or stop responding.
- An analysis plan agreed with a statistician before data collection. Analyzing longitudinal data with repeated hypothesis tests, as you would cross-sectional data, underestimates variability and raises the risk of false negatives (PMC).
A single cross-sectional survey fits when you need to describe current behaviors or exposure levels for surveillance and planning. Repeated cross-sectional studies track population trends by drawing independent samples at each wave, with little or no overlap between them. If you need to know whether an exposure came before a health event in the same person, use a prospective longitudinal design (PMC).
Why Snapshot Data Struggles to Show Cause and Effect
Snapshot data struggles with cause and effect because exposure and outcome are measured at the same moment, so the study usually cannot show which came first. Suppose a survey finds that people with back pain exercise less. The pain may have cut their exercise, or inactivity may have caused the pain. Because a cross-sectional study measures exposure and outcome at a single point in time, it captures prevalence and association rather than the individual-level change that longitudinal studies track by following the same participants over successive follow-ups.
Prevalence also blends how often a condition starts with how long it lasts. A one-time count over-represents long-lasting conditions compared with short episodes, so an association can reflect duration rather than risk.
The same logic applies beyond disease. A cross-sectional diagnostic model predicts current disease status only, and you cannot assume it will predict future events equally well. To establish the order of events, you need repeated measurements in the same people. Even then, a causal claim still requires careful handling of confounding.
Longitudinal Study vs Cross Sectional Comparison Table
Use the comparison above as a checklist when choosing between designs or appraising a paper. These are the mistakes researchers make most often:
- Calling a repeated survey a cohort. If each wave sampled different people, the study measured no within-person change, whatever its title says.
- Analyzing repeated measurements as separate surveys. A PMC review of longitudinal studies warns that running repeated hypothesis tests on longitudinal data, as you would on cross-sectional data, wastes available data, underestimates variability and raises the risk of false negatives (type II error). Use methods built for repeated measures instead.
- Picking an association measure out of habit. For chronic conditions, or diseases that take several months to develop, the prevalence odds ratio is often preferred over the prevalence ratio. The best choice still depends on the project, so talk to a statistician.
- Ignoring who drops out. If the participants who leave differ from those who stay, later waves describe a different group from the one you recruited.
- Overselling either design. State the limitations plainly. One-time data cannot show the order of events, and follow-up data cannot replace randomization.
Is a Cross-Sectional Study Qualitative or Quantitative?
A cross-sectional study is an observational design that measures exposures and health states in a defined population at a single point or over a short period. In health research it is usually quantitative. Its typical outputs are counts and proportions: prevalence with a 95% confidence interval, and comparisons between exposed and unexposed groups expressed as a prevalence odds ratio or prevalence ratio.
What defines the design is timing, not the type of data, so qualitative cross-sectional work exists too. The PLATINO study shows the typical quantitative pattern: researchers measured smoking history and spirometry at a single point in time in all participants, then reported COPD prevalence in five Latin American cities, ranging from 8% to 20%. Mixed-methods projects often pair a one-time survey with interviews of a subset of participants to explain the patterns in the numbers.
When choosing statistical tests for a numeric cross-sectional study, start by identifying the type of each variable, how the groups are structured and exactly what you want to find out. This step is easy to get wrong. A 2019 review of 83 case-control studies in orthopedics found that 51% used inappropriate statistical methods, which shows how often the analysis fails to match the design.
Longitudinal Study vs Cross Sectional Research: Weighing the Trade-Offs
Longitudinal research is the family of designs that measure a population on repeated occasions over time. In the narrower sense, a longitudinal study follows the same individuals from one measurement to the next. Most longitudinal studies are observational, though some are experimental. A cross-sectional study looks once. A longitudinal study gives up speed to see sequence and change.
The Framingham Heart Study is the classic example. It began in 1948 to identify risk factors for cardiovascular disease, recruited an original cohort of 5,209 people aged 30 to 62 from Framingham, Massachusetts, and followed them for 20 years. Many of the exposures it examined turned out to track closely with later cardiovascular disease: increasing age, higher weight, tobacco smoking, raised blood pressure, raised cholesterol and lower physical activity. The same review that calls it a model longitudinal study also notes that it carries a number of biases. Long cohorts rarely avoid them.
- What you gain: the order of events, within-person change, and insights into how risk factors develop before disease appears.
- What you pay: years of follow-up, work to keep people enrolled, larger budgets, and statistics that must model repeated measurements correctly.
- What you risk: loss to follow-up that skews later waves, and findings that arrive after the policy question has moved on.
Cross-sectional research reverses each line. It is quick, costs less and suits prevalence questions, but it says nothing about sequence. Many programs use both: they run a cross-sectional baseline survey and then follow part of that sample forward.
How Both Designs Work as Observational Studies Without Intervention
Both designs are observational. Researchers measure exposures and health events as they occur and do not assign any treatment, which is what separates these designs from randomized trials. That makes them the practical choice when an intervention would be unethical, impossible or premature, as with smoking, income or neighborhood conditions.
Working without an intervention has consequences. The main one is confounding: groups that differ in an exposure usually differ in other variables as well. Analysts therefore rely on adjustment methods such as matching or inverse probability weighting instead of randomization. Data taken from large databases built for other purposes can add error and misclassification. Longitudinal work adds attrition on top of this, because people who leave may differ from those who stay. Weighting methods are also used to adjust for data that go missing in a nonrandom way.
These points also shape how you read the literature in an evidence synthesis. When you screen and appraise observational studies for a review, record the design, the number of measurement occasions and how missing data were handled. Each one affects how much weight a study's insights deserve. Our guides on critical appraisal and meta-analysis cover the next steps.
Frequently asked questions
What are the pros and cons of a cross-sectional study?
On the plus side, a cross-sectional study measures key variables at a single point in time. That makes it a good fit for estimating prevalence and describing population health to inform surveillance and planning. It can report prevalence with a 95% confidence interval and compare exposed and unexposed groups using odds ratios or prevalence ratios. On the minus side, it does not follow the same people over time, so unlike a longitudinal study it cannot analyze change within individuals. Diagnostic models built this way predict current disease status only, not prognosis.
What is the difference between cross-sectional and longitudinal research?
Cross-sectional research measures a population once, while longitudinal research measures it repeatedly over time. The one-time design describes how common something is. The repeated design tracks change and the order of events. Prospective longitudinal studies follow the same individuals, while repeated cross-sectional studies draw a new sample at each wave.
What are longitudinal studies?
Longitudinal studies are research designs that collect data on repeated occasions over a period of time, from months to decades. They include prospective cohort studies that follow a fixed group, panel studies that re-interview the same respondents, and repeated cross-sectional surveys that use fresh samples. Most are observational, but some are experimental.
How to tell if a study is cross-sectional or longitudinal?
Check the methods section for how often data were collected and from whom. A cross-sectional study measures key variables at a single point in time in all participants, and it is designed to capture prevalence. A longitudinal cohort study follows the same participants through successive follow-ups to analyze individual-level change. A repeated cross-sectional study collects data more than once, but it draws an independent sample each time, with little or no overlap in who is surveyed.
Record the design for each included study during your systematic review.
What is an example of a longitudinal research study?
The Framingham Heart Study is the best-known example of a longitudinal research study. It began in 1948 and followed an original cohort of 5,209 adults aged 30 to 62 in Framingham, Massachusetts for 20 years. Its goal was to identify risk factors for cardiovascular disease, and the factors it examined included age, weight, smoking, blood pressure, cholesterol and physical activity.
What is a problem with longitudinal research?
A common problem with longitudinal research is faulty analysis. A methods overview of longitudinal studies calls analysis errors rampant. They most often happen when researchers run repeated hypothesis tests on each wave, the way they would for cross-sectional data. That approach underuses the data, underestimates variability, and raises the chance of a type II error, or false negative. Long follow-up is another demand. The Framingham Heart Study followed its original cohort of 5,209 adults for 20 years, and even that landmark study has known biases.
What is another name for a longitudinal study?
The most common alternative name is cohort study. One methods review puts the two terms side by side, describing "longitudinal or cohort studies" as designs that follow the same participants through successive follow-ups to analyze individual-level change. Another review uses longitudinal research as an umbrella term that covers more than one form. Prospective studies follow the same participants over time. Repeated cross-sectional studies sample largely or entirely different people each time, so they can show population trends but not change within individuals.