Review Paper Tables: Worked Examples and Templates
Review paper tables are the structured displays that carry a review's evidence: who was studied, what was compared, what the numbers showed, and how much confidence the result deserves. This guide is for anyone drafting a literature review, a systematic review, or a narrative synthesis who already has extracted data and now needs to turn it into tables an editor, a peer reviewer, or a guideline panel can read without hunting through the text.
Most writing advice stops at formatting rules. The harder problem is editorial: deciding how many tables a review needs, what belongs in each one, and which claims the prose should make instead. A review with one dense eight-column table usually needs two clearer ones. A review with nine tables usually has three that belong in an appendix. Good review paper tables answer a question the reader is already asking at that point in the paper, and they answer it in a form the reader can scan in about fifteen seconds.
What you need before you start is short but non-negotiable. You need a completed extraction form with consistent field names, so every study contributes the same variables. You need the unit and direction of each effect measure written down, because a risk ratio below 1 and a mean difference below 0 do not always mean the same thing for the reader. You need your risk of bias or certainty judgments finished, since those become columns rather than afterthoughts. And you need a working list of outcomes ranked by importance to the people who will use the review, because that list determines which rows survive.
The sections below walk through three worked examples, a reusable template set, and a step by step build for the summary of findings table, which is the single display most reviewers get wrong.
Key takeaways
- Review paper tables exist to let a reader check your reasoning without reopening every included study, so each one needs a purpose you can state in a single sentence before you draw a single column.
- Three table types cover most reviews: a study characteristics table, a results or pooled estimate table, and a summary of findings table that pairs each outcome with an effect estimate and a certainty rating.
- A summary of findings table reports the population and comparison, the outcomes that mattered to decision makers, absolute and relative effects, the number of participants and studies behind each row, and the certainty of the evidence with footnoted reasons.
- Column order carries meaning. Put the identifier first, the design and sample next, the outcome and effect estimate in the middle, and the judgment or certainty rating last so the row reads as an argument.
- Build tables from a structured extraction form rather than from your notes, and keep units, decimal places, and footnote markers consistent across every table in the paper.
From Reading Data Tables to Drafting Your Own
Data tables travel further than the paragraphs around them. A well-built table gets screenshotted into slide decks, pulled into guideline appendices, re-extracted by the next review team, and quoted in a policy brief long after the discussion section is forgotten. That portability is the practical reason to design tables as standalone objects: assume the reader arrives at your table with no context from the text.
Standalone means four things. The caption states the population, the comparison, and the outcome class, not just "Study characteristics." Every abbreviation appears in a footnote, even obvious ones such as RCT or CI. Every effect estimate carries its measure and its interval in the same cell. And every row names its source study, so a reader can verify one line without reconstructing your whole dataset.
Reading other people's tables is the fastest way to learn this. When you appraise an included study, note how its results table is organized and whether you could reuse that structure. The same instinct that drives critical appraisal applies to your own drafting: if you cannot tell from the table alone what was measured and in whom, neither can your reviewer. Strong review paper tables are built by writers who have spent time being frustrated by weak ones.
Worked Example One: Comparing Two Treatment Arms
A two-arm comparison table has one job: show what happened in each group and what the difference was. Give it five columns in this order: study and year, intervention arm result, comparator arm result, effect estimate with its confidence interval, and risk of bias judgment.
Say a review includes four trials of a supervised exercise program against usual care for chronic low back pain. Each row reports events over participants for a dichotomous outcome, such as 23/112 versus 41/108, then the risk ratio and interval in the fourth column, then low, some concerns, or high in the fifth. Keep the denominators visible rather than reporting percentages alone, because readers need the sample size to judge precision.
Two habits save you rework. Report the same effect measure in every row even when the source papers differ, and state in a footnote which estimates you recalculated. Keep decimal places uniform at two, so the eye compares magnitudes rather than string lengths. These small conventions are what separate review paper tables that look consistent from ones that look assembled by three different people.
Worked Example Two: Reporting Pooled Effect Estimates
A pooled estimate table carries one row per outcome rather than one row per study, which is the structural shift writers most often miss. Columns run: outcome, number of studies, number of participants, pooled effect with confidence interval, and a heterogeneity indicator.
For the exercise example, the pain intensity row might read 6 studies, 1,284 participants, standardized mean difference with its interval, and the I-squared value. The disability row sits beneath it with its own counts, because different outcomes rarely draw on the same set of studies. Listing study and participant counts per row stops readers from assuming your whole dataset contributed to every number.
Choose the model and say so in a footnote, with the estimator named rather than implied. Where pooling was not appropriate, keep the row and write "not pooled" with a brief reason instead of deleting the outcome, since a missing row reads as a missing outcome. The statistical choices behind these numbers belong in our meta-analysis guide; here the point is that review paper tables should make the basis of each pooled figure visible in the row itself.
Worked Example Three: Presenting Certainty of Evidence Ratings
A certainty table converts judgment into something auditable. Each row names an outcome and ends with a rating of high, moderate, low, or very low, and every downgrade is tied to a numbered footnote explaining which domain drove it.
The useful discipline is one footnote per decision, not one footnote per row. If the pain outcome was downgraded twice, once for risk of bias because three of six trials lacked blinded outcome assessment and once for imprecision because the interval crossed the minimal important difference, write both as separate notes. A reader who disagrees with one reason can then still accept the other.
Resist two shortcuts. Do not record only the final rating, because the rating without its reasoning is unverifiable. And do not downgrade for publication bias on the strength of a funnel plot with fewer than ten studies; say instead that assessment was not possible. Review paper tables earn trust by showing the reasoning chain, so a certainty column with transparent footnotes does more for your credibility than any amount of hedging in the discussion.
Downloadable Templates for Literature Review Tables
Three reusable templates cover the large majority of reviews, and you can build all three in a spreadsheet before you screen a single full text.
- Study characteristics template: author and year, country, design, setting, sample size, participant age and condition, intervention details with dose and duration, comparator, outcomes measured, and funding source.
- Results extraction template: study identifier, outcome name, time point, measure, result in each arm, effect estimate, interval, and a free-text note for anything you recalculated.
- Synthesis and certainty template: outcome, studies, participants, pooled or narrative result, certainty rating, and downgrade reasons.
Build them as one workbook with shared study identifiers so the third sheet draws on the first two. Freeze the header row, use a controlled vocabulary for design labels, and record missing data as "not reported" rather than leaving a blank, since blanks are ambiguous once the file passes to a co-author. Our literature review guide covers how these sheets feed the narrative sections of the paper.
What Goes Into a Summary of Findings Table
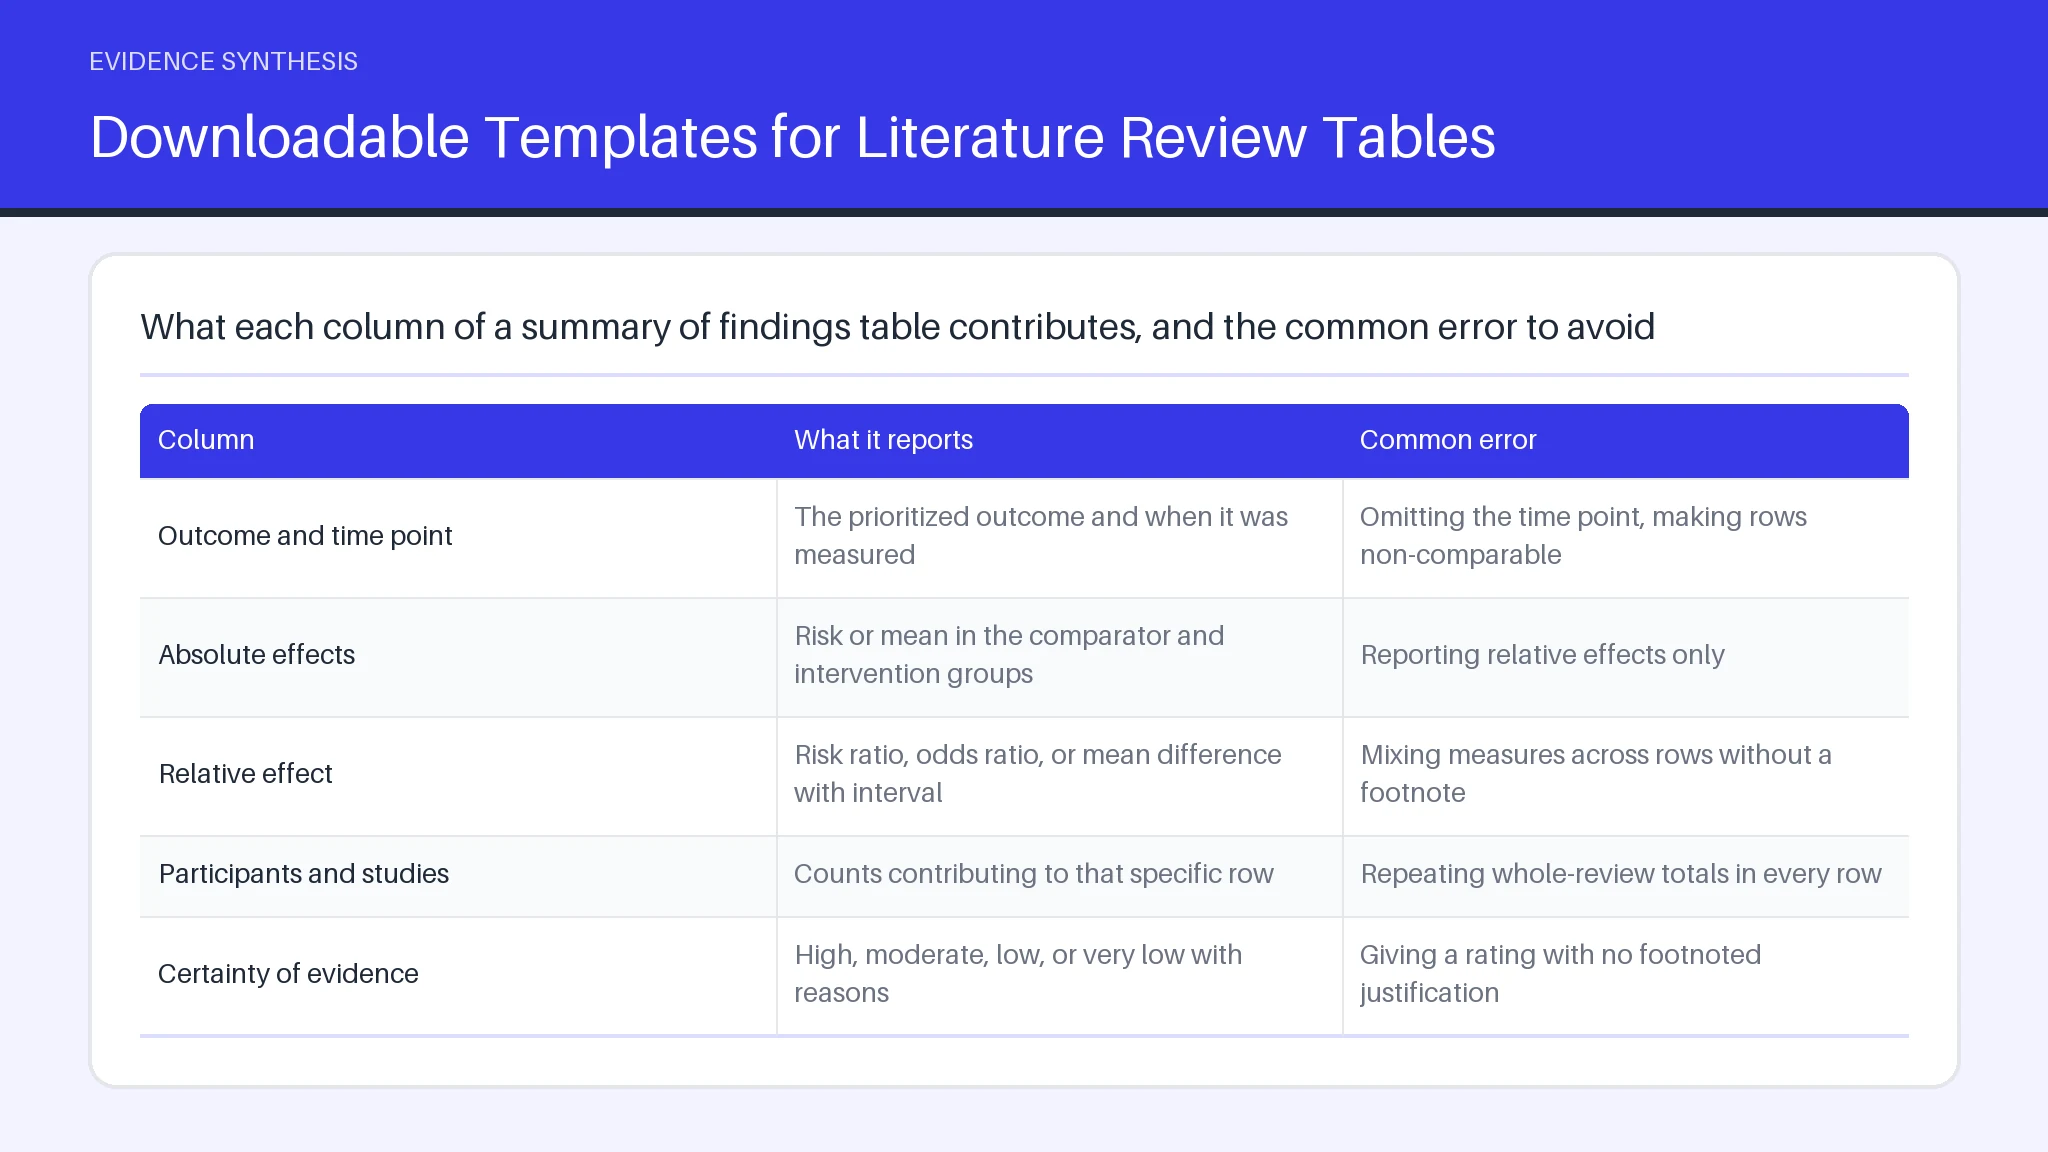
A summary of findings table includes seven elements: the population and setting, the intervention and comparator, each prioritized outcome, the absolute effect in both groups, the relative effect, the number of participants and studies contributing, and the certainty of the evidence with footnotes. Outcomes go in rows; those seven elements become the columns.
Two decisions shape the table more than any formatting choice. First, cap the outcome list at roughly seven, chosen for importance to decision makers rather than for statistical significance, and include critical harms even when the evidence is thin. Second, present absolute effects alongside relative ones, because a 30 percent relative reduction means something very different at a 2 percent baseline risk than at a 40 percent baseline risk.
| Column | What it reports | Common error |
|---|---|---|
| Outcome and time point | The prioritized outcome and when it was measured | Omitting the time point, making rows non-comparable |
| Absolute effects | Risk or mean in the comparator and intervention groups | Reporting relative effects only |
| Relative effect | Risk ratio, odds ratio, or mean difference with interval | Mixing measures across rows without a footnote |
| Participants and studies | Counts contributing to that specific row | Repeating whole-review totals in every row |
| Certainty of evidence | High, moderate, low, or very low with reasons | Giving a rating with no footnoted justification |
How to Build a Summary of Findings Table Step by Step
A summary of findings table is a one-page display that pairs each important outcome of a review with its effect estimate and a rating of how much confidence that estimate deserves. Build it in seven steps.
- Number and title the table. Use a sequential number in order of first mention, then a title naming the population, intervention, comparator, and setting, for example "Table 3. Supervised exercise compared with usual care for adults with chronic low back pain in outpatient care." The number lets the text cross-reference it; the title lets the table stand alone.
- Fix the outcome rows. Take them from your protocol, not from your results, and keep the protocol order so readers can see nothing was promoted after the fact.
- Enter comparator risk. Use the median control group risk across studies, or a named external source, and state which in a footnote.
- Add the relative effect with its confidence interval, using one measure per outcome.
- Calculate the corresponding intervention risk from the comparator risk and the relative effect, and report it per 1,000 people so the absolute difference is legible.
- Add participant and study counts for that row only.
- Assign certainty and footnote every downgrade.
Choosing among the main table variants comes down to the question at hand. Use a study characteristics table when readers need to judge applicability and heterogeneity of included work. Use a results table when the review reports outcomes study by study without pooling. Use a pooled estimate table when synthesis was quantitative. Use a summary of findings table when someone has to act on the review. Most systematic reviews need the characteristics table and one of the other three; adding all four usually duplicates content and pushes detail that belongs in supplementary files into the body of the paper.
Why Reviewers Include a Summary of Findings Table
Reviewers include a summary of findings table because it forces every consequential judgment in the review into one auditable place. The table includes the population and comparison, the prioritized outcomes, absolute and relative effects, the participants and studies behind each estimate, and a certainty rating with its reasons, so a reader can see not just what the review concluded but how firmly.
That has three practical consequences. It exposes gaps: an outcome with no row, or a row with 40 participants, tells a guideline panel where new research is needed. It separates effect size from confidence, which stops a large but fragile estimate from being read as settled. And it shortens peer review, because methodological questions that would otherwise be scattered across the results section arrive pre-answered in footnotes.
The trade-off is real. Building the table properly means finalizing your outcome priorities and certainty judgments before you draft the discussion, which front-loads work that many teams prefer to defer. It also makes weak evidence visible, so a review with four very low certainty rows reads as more tentative than its abstract might otherwise suggest. That visibility is the point, and it is why review paper tables of this kind have become an expectation rather than an optional extra in evidence synthesis.
Frequently asked questions
How do I write a table of contents for a review paper?
A table of contents for a review paper lists numbered sections with page numbers, and for most reviews it runs two levels deep. Give level one to the standard sections of the paper: introduction, methods, results, discussion, conclusion, references. Give level two to the subsections a reader might jump to directly, such as search strategy, eligibility criteria, data extraction, risk of bias assessment, and each synthesized outcome. Then add a separate list of tables and list of figures immediately after, each with its number, full title, and page. Generate all three lists automatically from your word processor's heading styles rather than typing them, because manual lists drift out of date with every revision. Keep level three headings out of the contents unless your review exceeds roughly 10,000 words. The structure of a research paper determines what belongs at each level.
Can you provide an example of a summary table?
A short summary table for the exercise review example would carry five columns and one row per outcome. Row one: pain intensity at 12 weeks, 6 studies and 1,284 participants, standardized mean difference favoring exercise with its confidence interval, control group mean, and moderate certainty downgraded once for risk of bias. Row two: disability at 12 weeks, 4 studies and 812 participants, mean difference with interval, control group mean, and low certainty downgraded for risk of bias and imprecision. Row three: serious adverse events, 3 studies and 640 participants, risk ratio with a wide interval crossing 1, event counts in both arms, and very low certainty. Each row stands alone, each count belongs only to that outcome, and the numbers in the certainty column trace to footnotes rather than sitting unexplained.
How Do You Make A Summary Of Findings Table For A Systematic Review?
Making a summary of findings table for a systematic review starts in the protocol and ends after synthesis. Rank your outcomes before searching, extract both effect estimates and the denominators behind them, complete risk of bias assessment at the outcome level, then build the table row by row from those extracted fields. Work from the extraction sheet rather than from the papers, since re-reading sources at table-building stage is where transcription errors enter. Review software can assemble these rows from structured extraction fields, and Systematicly is built around that workflow; our tools comparison sets out what such platforms do and do not automate. Whatever you use, keep it simple: one message per table, consistent units, and no column you cannot justify. Tables matter because they are the part of a review that other researchers reuse, and clarity there outlasts the prose around it.
What should you know about built for research workflows?
Software that is built for Research workflows keeps extraction fields, risk of bias judgments, and table output in one linked chain, so a change to an extracted value flows through to the display rather than being retyped. Judge any such tool on whether it exports the structure your target journal expects and whether you can audit every cell back to its source study. If you cite this post, treat it as guidance on drafting practice, not as a methods standard.